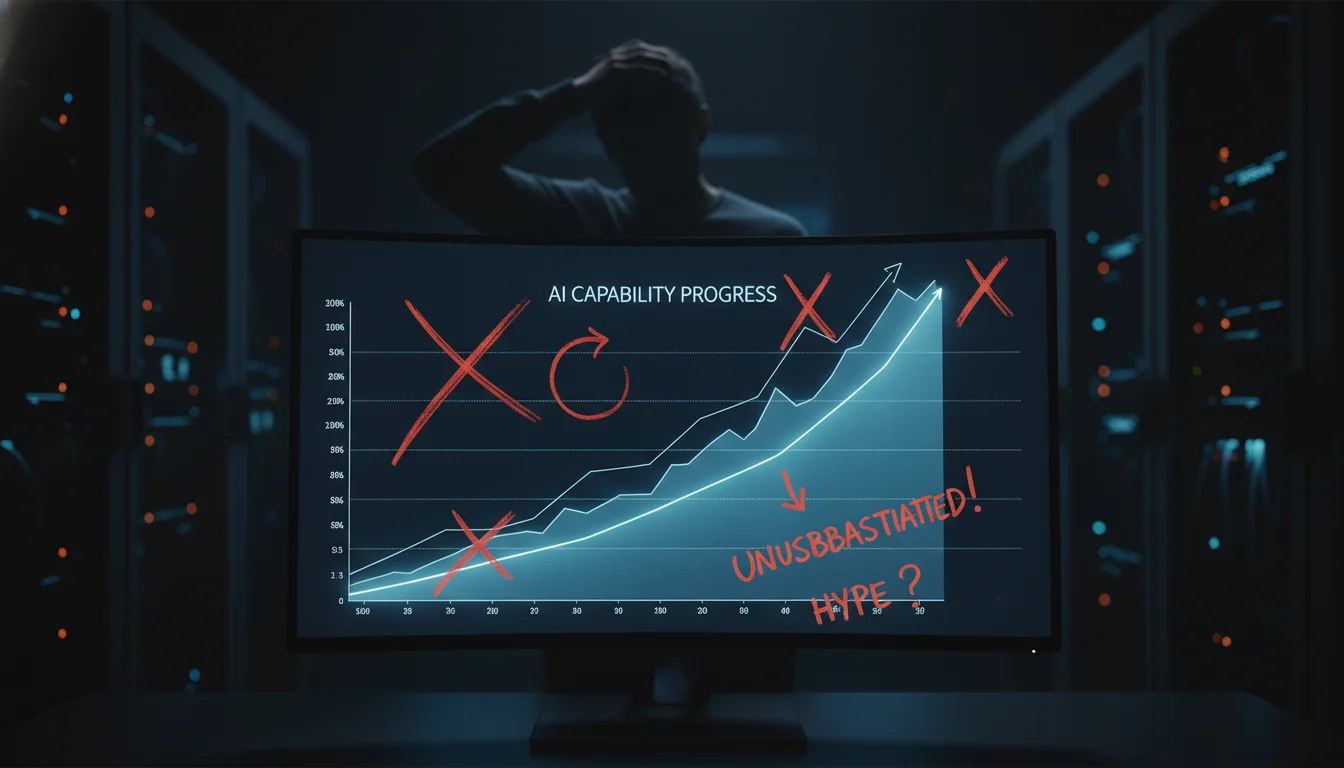
The Meter time-horizon chart — showing AI completing tasks with multi-hour time horizons — became the most-shared AI benchmark chart of 2025. Executives sent it to boards. Investors revised their timelines. The problem: almost nobody noticed the fine print at the bottom. The fine print says it measures what a "low context" person would take. Not an expert. Not general intelligence. A low-context person. Cal Newport spent weeks analyzing what the benchmark actually measures. What he found dismantled the entire narrative.
What the Meter Chart Actually Measures
Meter's time horizon benchmark tracks SWE-Bench Verified and a cluster of related coding tasks. The core question it poses is deceptively simple: how many hours would it take a low-context software engineer to complete this task? That qualifier — low context — is buried in Meter's own documentation, and it does enormous interpretive work. It refers specifically to an engineer who doesn't know the codebase and has to read and understand it before making meaningful progress.
That framing is not a measure of general intelligence. It's a measure of how fast a model can parse and respond to code that already exists in a structured repository. The benchmark is essentially asking: how quickly can this system orient itself in unfamiliar but well-documented code? That's a useful, narrow question. It's not the question most people thought they were seeing answered.
The reliability numbers make the picture sharper. The current best-performing model hits 50% task completion reliability at 16-hour tasks. Reliability climbs to 80% only for tasks in the 3-hour range or below. When the chart is described as showing AI handling "multi-hour work," the implicit claim is of reliable execution. The actual data shows reliability degrading steeply as task complexity increases — a detail the viral versions of the chart don't surface. This is also a benchmark designed to be optimized for, and the optimization pressure has been applied aggressively over the past two years.
The Number That Went Viral Is Wrong
The chart's apparent leap — from roughly 2-hour to 7-hour time horizons in approximately one year — became the data point that drove the AGI-is-near narrative through late 2025 and into early 2026. Analysts drew exponential curves through it. Forecast models were updated. The problem Newport flags is basic: two data points don't make a trend.
"You cannot declare exponential growth from two data points," Newport said on the Deep Questions podcast. "Every startup founder knows this. Journalists apparently don't." The rhetorical move from two benchmark measurements to an exponential trajectory toward AGI is not analysis — it's storytelling that happens to have numbers in it.
Broader capability tracking tells a different story. The Economic Complexity Index approach applied to AI capability across a wider range of task types — not just coding — shows linear growth, not exponential. The pre-training scaling wall hit in the summer of 2024. The period that everyone interpreted as an exponential leap was actually the final peak of the old scaling curve, where the last gains from increased compute and data size were being harvested. What appears as exponential on the Meter chart is an artifact of benchmark narrowness and the intensity of optimization aimed directly at it.
What's Really Driving the Jump: Leaked Source Code
Newport's sharpest insight came not from the benchmark data itself but from leaked Claude Code source code that circulated in AI research circles during late 2025. The source code revealed that the scaffolding surrounding Claude Code relies heavily on classic expert-system architecture: pattern matching, rule-based fallback hierarchies, pre-written heuristics for common coding task types that engineers encounter repeatedly in real codebases.
This is not a neural capability leap. It is engineering. The system completing coding tasks at longer time horizons is a language model embedded inside a substantial scaffolding structure built by human engineers over roughly two years. That scaffolding handles orientation in unfamiliar code, structures the model's output, routes it through validation loops, and applies domain-specific heuristics that were hand-coded by people who studied where models failed. The benchmark measures the entire system's performance — scaffolding and all — not the underlying model's raw capability gain.
"They've built a sophisticated expert system around a language model and measured the expert system's performance on the task it was explicitly designed for."
Cal Newport — Deep Questions PodcastThe implication is significant. If the jump in Meter's time-horizon numbers reflected a genuine leap in model capability, you'd expect to see comparable gains across different task domains where similar models are deployed. You don't see that. What you see is fast progress on coding benchmarks — exactly the domain where the most sophisticated scaffolding has been built — and much slower, uneven progress elsewhere. The benchmark is measuring the scaffolding's effectiveness on the task the scaffolding was built for. Calling that general AI progress is a category error.
Right Mental Model: Tributaries Not Rising Water
Newport's alternative framing for understanding AI capability progress is worth adopting wholesale. Think of AI capability not as a rising ocean — an undifferentiated tide that lifts all tasks equally — but as a river delta. Individual capability channels are advancing at different rates through different engineering paths. Some tributaries are running fast. Others are barely moving.
Meter measures one tributary: enterprise coding in well-documented codebases with extensive scaffolding support. That tributary is running fast. It's been the focus of concentrated engineering effort, benchmarking attention, and capital allocation for several years. The overall water level — general intelligence, the capacity to handle novel tasks without domain-specific scaffolding — is not rising at the same rate as the fastest tributary. It's rising slowly, linearly, and unevenly.
This distinction has direct operational implications. Executives who see the Meter chart are making decisions about general AI capability based on evidence that applies specifically to one narrow channel. The practical result: AI is extremely capable in specific, well-scaffolded domains, and notably weaker in novel domains where no scaffolding infrastructure has been constructed. The chart doesn't reveal this gap — it obscures it.
The Transhumanist Influence Problem
Newport identified a specific distortion mechanism in how AI benchmark data gets filtered into mainstream coverage. Several of the most prominent AI benchmark trackers — the people who compile, visualize, and distribute this data to the audiences that actually set corporate strategy — have made public, personal commitments to transhumanist timelines. They have gone on record with AGI-by-2027 or AGI-by-2028 predictions. Their identities are publicly tied to those predictions being correct.
When your prior belief is that AGI is arriving within three years, you are primed to interpret every benchmark jump as confirmation. This isn't fraud. It's motivated reasoning at scale, amplified by social media dynamics that reward confident, dramatic takes over careful qualification. When a prominent benchmark curator shares the Meter chart with commentary suggesting it confirms the AGI timeline, they're not lying — they're seeing what they expect to see. Their followers, who have no reason to distrust them, inherit the interpretation along with the chart.
The result is that the benchmark chart most people encounter has already been interpreted by people who need it to look exponential. Newport's prescription is simple: when you encounter an AI capability claim, ask who built the benchmark, who is reporting it, and what their prior timeline commitments are. The answer to those three questions explains most of what you need to know about why the chart looks the way it does.
What This Means for Practitioners
If you're building AI tools or deploying agents, the Meter chart does tell you something specific and useful. It tells you that enterprise coding tasks in well-documented codebases are now highly automatable — more automatable than they were two years ago, with reliability improving in the 3-hour-and-under range. That's actionable. Build on it. The chart does not tell you that general task automation is around the corner, and planning as though it does is where the real strategic risk lives.
Newport's actual forecast, stripped of the chart's framing: coding assistance and code generation will continue improving fast, because that's where engineering effort, benchmarking attention, and capital are concentrated. Adjacent domains with sufficient structure — code review, automated audit, documentation generation — will see meaningful gains. Everything else will improve slowly and unevenly, at a pace closer to the broader linear trend than to the Meter chart's apparent trajectory.
| Domain | AI Progress Rate | Engineering Scaffolding | Newport's Assessment |
|---|---|---|---|
| Enterprise coding | Fast | Extensive (2+ years) | Deploy now |
| Code review / audit | Fast | Moderate | Deploy now |
| Novel domain reasoning | Slow | Minimal | Wait |
| Physical task automation | Very slow | Nascent | 5+ years |
| General intelligence | Linear, not exponential | None | No timeline |
The planning error most companies are currently making is treating coding AI progress as a valid proxy for general AI progress, then building roadmaps around capabilities that don't exist yet and won't exist on the implied schedule. Product teams are scoping features that assume reliable multi-domain autonomous agents. Infrastructure teams are deferring human hires against an expected automation wave. These decisions are being made on the basis of a chart that measures a narrow, heavily engineered coding system and labels it general intelligence progress.
Newport's advice is direct: "Build on what's actually there. Not on what the chart implies is coming." The chart implies a great deal. What's actually there is a powerful, narrow capability with hard reliability limits above the 3-hour task threshold. That capability is genuinely valuable. Deploy it where it works. Don't mistake it for a preview of everything else.
Related Reading
For the attention bottleneck that scaffolded AI helps solve: AI Agents Have an Attention Bottleneck Nobody Is Talking About. On why the demand for AGI-level capability may be overstated: The AI Bubble's Missing Demand Problem. On how AI agents actually get deployed in enterprise settings: The CEO Sycophancy Trap.